Geo-Referenced Data Visualization with Angular, D3 & Turf.js
by Henrik Bolte, Software Engineer
Introduction
In our latest project, we demonstrate how to work with and visualize geo-referenced data. We'll use GeoJSON and turf.js for geographic computations within an Ionic Angular app, enhanced with D3-Geo for visualizations. This tutorial will walk you through defining an example land plot as an irregular quadrilateral and computing its centroid.
Prerequisites
Before getting started, make sure you have the following tools installed:
- Node.js
- npm (Node Package Manager)
Setting Up the Project
-
Clone the repository:
git clone https://github.com/hbolte-ltd/tutorial-geojson-d3-ionic-angular.git cd tutorial-geojson-d3-ionic-angular -
Install the required npm packages:
npm install
Defining the Example Data
Geo-referenced data, depending on the application, can come from various sources:
- Any GeoJSON data: Manually created or obtained GeoJSON data.
- Embedded map libraries, e.g., Google Maps, Mapbox: Data visualized and integrated directly from these libraries.
- Backend data sources: Dynamic data fetched from backend APIs.
For this tutorial, we'll use a hardcoded GeoJSON example to define an irregular quadrilateral with four corners. Here's how you can do this in TypeScript:
import { Polygon } from 'geojson'
import { centroid } from '@turf/turf'

// Define the polygon for the boundary with four corners
const boundary: Polygon = {
  type: 'Polygon',
  coordinates: [
    [
      [100.501762, 13.75381], // Corner 1
      [100.502076, 13.75429], // Corner 2
      [100.502591, 13.754102], // Corner 3
      [100.502278, 13.753622], // Corner 4
      [100.501762, 13.75381], // Closing the polygon = Corner 1
    ],
  ],
}

// Use turf.js to calculate the precise centroid (midpoint)
const center = centroid(boundary)
In this code snippet, we define the boundary of our example data using GeoJSON format and compute the centroid using
turf.js.
Visualizing the Data
Next, we'll visualize our example data using a custom Angular component called polygon-vector. This component takes
several inputs, including the boundary and centroid.
Add the polygon-vector component to your template:
<app-polygon-vector
  [boundary]="boundary"
  [centroid]="center"
  [width]="300"
  [height]="300"
  [padding]="30"
  [primaryColor]="'#0099aa'"
  [backgroundColor]="'#eff0f1'"
  [showCentroid]="true"
  [showPointLabels]="true"
  [dashedStroke]="true"
>
</app-polygon-vector>
Running the Application
To see the visualization in action, simply serve the Angular application using the npm script:
npm startYou should see the following content:
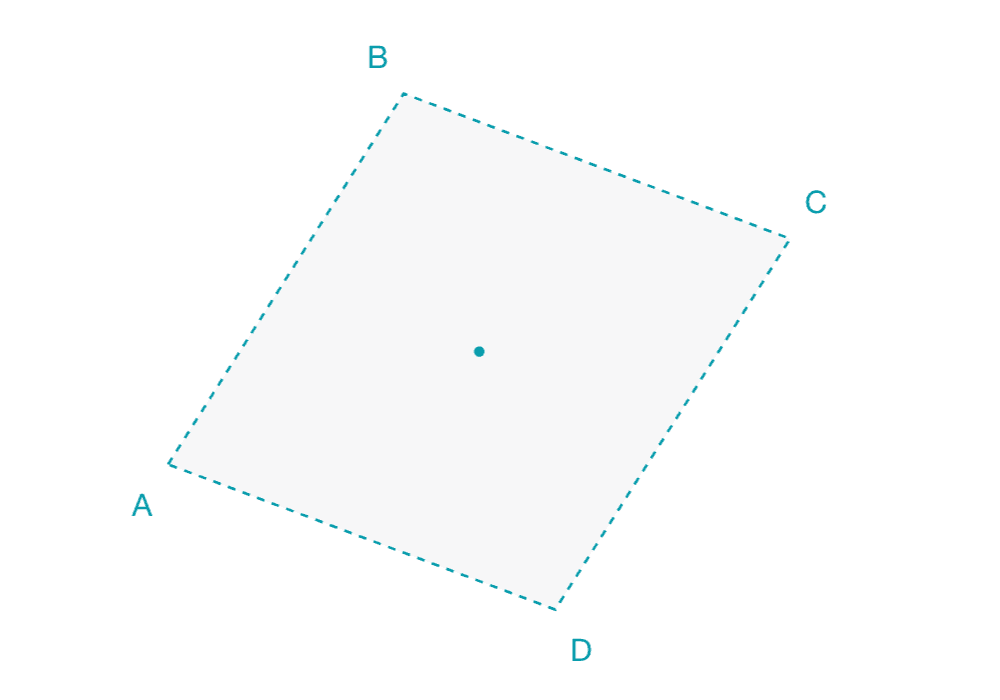
How it works
The Angular Component Structure
The PolygonVectorComponent is an Angular component that visualizes the given polygon and its centroid using D3.js.
import {
  Component,
  OnChanges,
  AfterViewInit,
  Input,
  NgZone,
  ChangeDetectorRef,
} from '@angular/core'
import { geoMercator, geoPath, select, zoom } from 'd3'
import { Point, Polygon } from 'geojson'
import { rewind } from '@turf/turf'- Imports necessary Angular modules and D3 functions.
- The Polygon and Point types from GeoJSON.
- The rewind function from Turf.js to ensure the polygon's coordinates are in the correct winding order.
Component Inputs and Initialization
@Component({
  selector: 'app-polygon-vector',
  templateUrl: './polygon-vector.component.html',
  styleUrls: ['./polygon-vector.component.scss'],
})
export class PolygonVectorComponent implements OnChanges, AfterViewInit {
  @Input() public boundary!: Polygon
  @Input() public centroid!: Point
  @Input() public id = 'd3-vector'
  @Input() public width = 250
  @Input() public height = 250
  @Input() public padding = 25
  @Input() public showCentroid = false
  @Input() public showPointLabels = false
  @Input() public primaryColor!: string
  @Input() public backgroundColor!: string
  @Input() public dashedStroke = true

  private svg: any

  constructor(private cdRef: ChangeDetectorRef, private ngZone: NgZone) {}

  public ngOnChanges(): void {
    this.updateView()
  }

  public ngAfterViewInit(): void {
    this.updateView()
  }
}- The component accepts several inputs, including the polygon (boundary), centroid, display options, colors, and dimensions.
- The
ngOnChangesandngAfterViewInitlifecycle hooks trigger theupdateViewmethod to update the visualization whenever inputs change.
Creating the SVG and Projection
  private updateView(): void {
    this.ngZone.run(() => {
      if (this.boundary) {
        this.createSvg(this.boundary, this.padding);
      }
    });
  }

  private createSvg(polygon: Polygon, padding: number): void {
    if (this.svg) {
      this.svg.remove();
    }

    polygon = rewind(polygon, { reverse: true }) as Polygon;

    const svgPadding = [padding, padding];
    const svgExtent: [[number, number], [number, number]] = [
      [svgPadding[0], svgPadding[1]],
      [this.width - svgPadding[0], this.height - svgPadding[1]],
    ];

    const projection = geoMercator().fitExtent(svgExtent, polygon);

    this.svg = this.createMapElement(projection, polygon);

    if (this.showCentroid) {
      this.addCentroidToMap(this.svg, projection, polygon);
    }

    if (this.showPointLabels) {
      this.addPointLabelsToMap(this.svg, projection, polygon);
    }

    this.cdRef.detectChanges();
}updateViewensures that any changes to input properties trigger a redraw of the component.- In createSvg, if an existing SVG element is present, it is removed before creating a new one.
- The geoMercator projection is utilized to fit the polygon within the provided dimensions.
Adding the Polygon to the Map
  private createMapElement(projection: any, polygon: Polygon): any {
    const svg = select(`#${this.id}`)
      .append("svg")
      .attr("width", this.width)
      .attr("height", this.height);

    svg
      .selectAll("path")
      .data([polygon])
      .enter()
      .append("path")
      .style(
        this.dashedStroke ? "stroke-dasharray" : "stroke-width",
        this.dashedStroke ? "3, 3" : "1"
      )
      .attr("d", geoPath().projection(projection))
      .style("fill", this.backgroundColor)
      .style("fill-opacity", 0.5)
      .style("stroke", this.primaryColor);

    return svg;
}createMapElementmethod creates an SVG element and appends it to the DOM.- The polygon data is bound to a path element, and styled according to the defined properties.
Adding the Centroid to the Map
  private addCentroidToMap(svg: any, projection: any, polygon: Polygon): void {
    svg
      .selectAll("centroid")
      .data([polygon])
      .enter()
      .append("circle")
      .attr(
        "cx",
        (feature: any) => geoPath().projection(projection).centroid(feature)[0]
      )
      .attr(
        "cy",
        (feature: any) => geoPath().projection(projection).centroid(feature)[1]
      )
      .attr("r", "2px")
      .style("fill", this.primaryColor);
}addCentroidToMapmethod adds a circle at the centroid of the polygon by calculating its position using the geoPath projection.
Bonus: Adding Corner Labels to the Map
    private addPointLabelsToMap(svg: any, projection: any, polygon: Polygon) {
      const nPoints = polygon.coordinates[0].length - 1;
      const centroidX = geoPath().projection(projection).centroid(polygon)[0];
      const centroidY = geoPath().projection(projection).centroid(polygon)[1];

      for (let i = 0; i < nPoints; i++) {
        const geoBefore = polygon.coordinates[0][i];
        const pointBefore = projection(geoBefore);

        if (!pointBefore) continue;

        const letter = this.getLetter(i);

        const xSign = pointBefore[0] <= centroidX ? -1 : 1;
        const ySign = pointBefore[1] <= centroidY ? -1 : 1;

        const upperPaddingRatio = 0.5;
        const lowerPaddingRatio = 1;

        const paddingX = 10;
        const paddingY =
          ySign == -1 ? upperPaddingRatio * 20 : lowerPaddingRatio * 20;

        svg
          .selectAll("corners")
          .data([polygon])
          .enter()
          .append("text")
          .attr("x", pointBefore[0] + xSign * paddingX)
          .attr("y", pointBefore[1] + ySign * paddingY)
          .attr("text-anchor", "middle")
          .style("font-size", "12px")
          .style("fill", this.primaryColor)
          .text(letter);
      }
}addPointLabelsToMapmethod adds labels to each corner of the polygon.- The labels are positioned relative to the centroid, ensuring they do not overlap with the polygon's boundaries.
In summary, this Angular component visualizes a polygon provided in GeoJSON format, using D3.js for rendering. It projects the data using a mercator projection, adds the polygon itself, computes and adds the centroid point, and optionally labels each corner of the polygon. This structure and methodology provide a comprehensive and interactive way to visualize geo-referenced data.
Enhancing Interactivity and Accuracy with D3, Turf.js, and SVG Vectors
Leveraging D3 for Interactivity
D3.js is a powerful library for creating dynamic, interactive visualizations. One of the key benefits of using D3 is its ability to bind data to the DOM and apply data-driven transformations. To enhance user interactivity, consider adding zoom and pan features to your SVG elements:
import * as d3 from 'd3'

// Select the SVG element
const svg = d3.select('svg')

// Add zoom and pan behavior
svg.call(
  d3
    .zoom()
    .scaleExtent([1, 10]) // Set zoom scale limits
    .on('zoom', (event) => {
      svg.attr('transform', event.transform)
    })
)
This small snippet enables users to zoom and pan across your geo-referenced map, improving user engagement and accessibility.
Using Turf.js for Geographic Accuracy
Turf.js is not just for calculating centroids; it offers a variety of geographic functions like buffering, clipping, and measuring distances. For example, you can use Turf.js to create buffer zones around your polygons:
import { buffer, polygon } from '@turf/turf'

// Create a buffer around the boundary by 100 meters
const buffered = buffer(boundary, 100, { units: 'meters' })
Buffering is useful in many scenarios, such as planning utility zones or calculating the area of influence around geographic features.
SVG Vectors for Crisp Graphics
Scalable Vector Graphics (SVG) are ideal for rendering crisp and scalable geo-referenced data visualizations. Using SVG ensures that your graphics remain sharp at any zoom level, which is particularly important for detailed maps and complex data visualizations. Here's an example of creating an SVG element in Angular:
<svg width="500" height="500" xmlns="http://www.w3.org/2000/svg">
  <polygon
    points="100,10 40,198 190,78 10,78 160,198"
    style="fill:lime;stroke:purple;stroke-width:1"
  />
</svg>
SVG elements can be styled and manipulated easily with CSS and JavaScript, providing ample flexibility for designers and developers.
Why It Matters
Combining the power of D3 for interactivity, Turf.js for geographic calculations, and SVG for rendering ensures that your application is not only visually appealing but also accurate and user-friendly. These tools work together to create a seamless experience for users interacting with geo-referenced data, making your application stand out in terms of both performance and usability.
Top tip
Consider these techniques to enhance your geo-referenced data visualization project, providing users with an enriched and interactive experience.
By incorporating these practices, your application will offer superior interactivity, precision, and visual clarity, setting a high standard for geo-referenced data visualizations.
Conclusion
With this setup, you can easily define and visualize geo-referenced data. The combination of Angular, D3, and turf.js
provides a powerful toolkit for geographic computations and visualizations.
GitHub Repository
Get the full source code: 🔗 GitHub
Run in the browser: ⚡ StackBlitz
Get in Touch
We’re here to help you take your projects to the next level. Whether you have questions, need assistance, or are looking to leverage our expertise in software development, our team is ready to assist you.